

Ethereum is trying to stabilize after a sharp correction, but the next move still depends on one simple question: Can ETH reclaim $1,800, or does $1,600 fail first?
At the time of writing, ETH is trading close to $1,775, leaving it stuck between an important support zone around $1,600 and short-term resistance near $1,800. That makes the current setup more of a decision point than a clean bullish reversal.
Ethereum’s price action looks fragile, but not broken. ETF flows have been weak, sentiment is cautious and the chart still needs confirmation. At the same time, Ethereum’s network activity remains resilient, with daily active addresses recently around 590,000, up roughly 18% year over year, according to YCharts data sourced from Etherscan.
Go directly to
- 1 Key Takeaways
- 2 Why $1,600 and $1,800 Matter Now
- 3 What Changed for Ethereum?
- 4 Ethereum Network Activity Is Holding Up
- 5 Technical Analysis for Ethereum (ETH)
- 6 What the RSI and Volume Suggest
- 7 Risks to Watch
- 8 What Could Push Ethereum Higher?
- 9 Bullish vs Bearish Scenarios
- 10 Outlook: Ethereum Is Stable, Not Safe Yet
- 11 Ethereum FAQ
Key Takeaways
| ETH factor | Current signal |
|---|---|
| Price trend | Stabilizing, but still below major resistance |
| Key support | $1,600, then $1,500 and $1,250 |
| Key resistance | $1,800, then $2,000 and $2,500 |
| ETF flows | Recently weak, but the last three days show inflow according to CoinGlass data. |
| On-chain activity | Still relatively strong |
| Market mood | Cautious, not fully capitulated |
Why $1,600 and $1,800 Matter Now
Ethereum is currently trading in a narrow but important range. The $1,600 area has acted as the first meaningful support zone during the latest correction. If ETH continues to hold above this level, traders may see it as a sign that selling pressure is starting to fade. But if $1,600 breaks decisively, the next downside levels to watch are $1,500 and then $1,250.
On the upside, $1,800 is the first major hurdle. A move above $1,800 would not automatically confirm a new bull trend, but it would show that buyers are finally pushing ETH back above the area where recent sellers have been active.
In practical terms:
Above $1,800: the chart improves, and $2,000 comes back into focus.
Below $1,600: downside risk increases, with $1,500 likely to be tested.
Between $1,600 and $1,800: ETH remains in consolidation.
What Changed for Ethereum?
Ethereum’s correction has been driven by a mix of weaker risk appetite, cautious institutional demand and softer ETF flows.
Reuters recently reported that Citi cut its Bitcoin and Ether forecasts, citing weaker investor appetite, negative ETF flows and limited progress on U.S. digital asset legislation. Citi lowered its Ether forecast to $2,240, down from $3,175.
That does not mean ETH is structurally broken. It does mean traders are no longer giving Ethereum the benefit of the doubt. In this market, ETH needs proof: stronger volume, better ETF flows and a clear reclaim of resistance.
Ethereum Network Activity Is Holding Up
One reason the setup is not purely bearish is that Ethereum’s network usage has not collapsed.
YCharts shows Ethereum daily active addresses recently at roughly 590,654, up from about 500,537 one year earlier. That suggests the network is still being used even while ETH’s price has been under pressure.
Etherscan also points indicate that Ethereum continues to process a large number of daily transactions, with the network reaching a record high of more than 3.6 million daily transactions on April 28, 2026.
This is the key distinction: Ethereum’s price momentum has weakened, but its network utility still looks alive. In other words, while traders have become more cautious, the Ethereum ecosystem itself continues to demonstrate resilience through steady on-chain participation. That matters because major crypto bottoms are often easier to trust when price weakness is not matched by a collapse in real usage.
Technical Analysis for Ethereum (ETH)
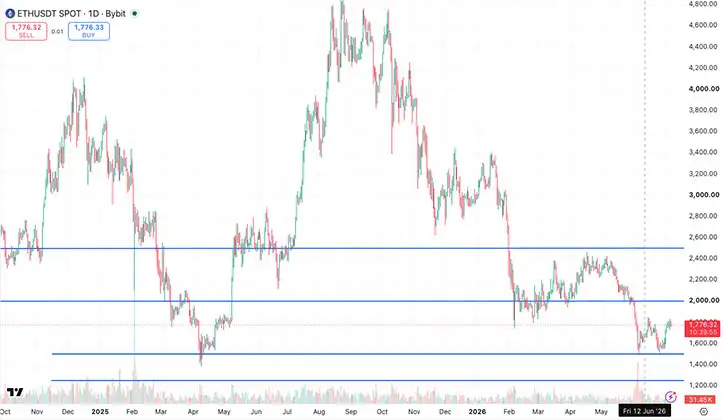
The current ETH chart revolves around a few key support and resistance levels:
- $2,500: Larger resistance if ETH regains stronger upside momentum.
- $2,000: Important psychological resistance and the next upside test above $1,800.
- $1,800: First major breakout level and the key short-term resistance to watch.
- $1,600: Current key support zone that bulls need to defend.
- $1,500: Next downside level if $1,600 fails to hold.
- $1,250: Deeper support zone if selling pressure accelerates further.
The current structure is not especially bullish yet. ETH needs to reclaim $1,800 and hold above it for 24 hours before the short-term trend looks healthier.
However, the failure to break down hard below $1,600 also matters. Sellers had an opportunity to push ETH lower, and so far that level has held. That makes the next breakout or breakdown more important.
Source: TradingView, Chart as of June 22, 2026 and ETH price at time of analysis
Key levels: Support $1,600 / $1,500 / $1,250. Resistance $1,800 / $2,000 / $2,500
What the RSI and Volume Suggest
The RSI has recovered from deeply oversold territory, suggesting that bearish momentum has cooled. However, it does not yet confirm strong bullish momentum.
That distinction matters. In early June, Ethereum’s RSI fell as low as 13, a level that often reflects extreme selling pressure. By the time of writing, the RSI had recovered to around 55, showing a clear improvement in short-term momentum. Still, a rebound from oversold levels can signal relief without confirming that a sustainable uptrend has started.
Volume tells a similar story. Selling volume spiked during the correction and then normalized. That may suggest a short-term flush or capitulation style move, but the rebound still needs stronger buying volume before traders can treat it as a confirmed reversal.
Risks to Watch
Ethereum still has several near-term risks.
The first is technical: a break below $1,600 would weaken the setup and make $1,500 the next level to watch.
The second is institutional demand. If spot ETH ETFs continue to see net outflows, that could limit ETH’s ability to recover quickly. ETF demand matters because it gives larger investors a regulated way to gain exposure. When that demand fades, the market often loses an important source of buying pressure.
The third risk is broader market sentiment. ETH still trades like a risk asset. If equities, Bitcoin or crypto sentiment weaken again, Ethereum could struggle even if its own network fundamentals remain solid.
What Could Push Ethereum Higher?
Ethereum does not need everything to go right. It needs a few important things to improve at the same time.
A stronger ETH setup would likely require:
A daily close above $1,800.
Improving ETF flows.
Bitcoin and broader crypto sentiment stabilizing.
Continued growth in stablecoins, DeFi, tokenized assets and Layer 2 activity.
Stronger volume on rebounds.
Ethereum’s long-term investment case still depends heavily on its role as infrastructure for decentralized finance, stablecoins, tokenized assets and smart contracts. That story has not disappeared. The problem is that traders are currently focused more on liquidity, flows and macro risk than on the long-term Ethereum roadmap.
Bullish vs Bearish Scenarios
Ethereum’s next move depends on whether buyers can reclaim $1,800 or sellers push ETH below $1,600. These are the main scenarios to watch:
| Scenario | What would confirm it? | Likely next level |
|---|---|---|
| Bullish reversal | ETH reclaims $1,800 with stronger buying volume. | $2,000 first, then $2,500 if momentum improves. |
| Sideways market | ETH stays trapped between $1,600 support and $1,800 resistance. | Continued consolidation and choppy trading. |
| Bearish breakdown | ETH loses $1,600 decisively, especially on rising volume. | $1,500 first, then $1,250 if selling accelerates. |
Outlook: Ethereum Is Stable, Not Safe Yet
Ethereum is in a better position than it was during the sharpest part of the sell-off, but it has not yet confirmed a new uptrend.
The most honest reading is this: ETH is stabilizing near support, but bulls still need to prove control above $1,800.
If ETH breaks above $1,800 and ETF flows improve, the market may start looking toward $2,000 again. If $1,600 fails, the tone changes quickly, and traders will likely focus on $1,500 next.
For now, Ethereum is not a clean breakout trade. It is a watchlist setup. The chart is waiting for confirmation, and so should traders.
Ethereum FAQ
Is Ethereum bullish or bearish right now?
Ethereum is neutral to cautious in the short term. Holding $1,600 is positive, but ETH needs to reclaim $1,800 before the chart looks meaningfully stronger.
What is the key ETH support level?
The most important support level is currently around $1,600. If that breaks, traders may look toward $1,500 and then $1,250.
What is the key ETH resistance level?
The first major resistance level is $1,800. Above that, the next important levels are $2,000 and $2,500.
Are Ethereum fundamentals still strong?
Ethereum network activity remains relatively resilient. Daily active addresses are still up year over year, and transaction activity remains significant, even though ETH price momentum has weakened.
Disclaimer: The information provided in this analysis is for educational and informational purposes only and does not constitute financial, investment, legal, or tax advice. Always conduct your own research and consult a qualified professional before making financial decisions.