Bitcoin (BTC) has fallen from $82,814 on May 6, 2026, to a low of $59,073 before recovering to around $63,001 at the time of writing.
The correction erased a significant portion of the gains recorded earlier this year and pushed several on-chain metrics into territory often associated with bear-market conditions. One of the most closely followed indicators is realized losses. According to on-chain analytics platform CryptoQuant, Bitcoin investors have realized approximately $174 billion in losses since the market peak. While this represents substantial selling pressure, it remains below the $211 billion recorded during the 2022 bear market despite Bitcoin’s significantly larger market capitalization today. That is a noteworthy difference.
Realized losses are large in absolute terms, but relative to Bitcoin’s size they remain less severe than during the previous bear market
This suggests that the current correction has not yet produced the same degree of capitulation seen during previous major market bottoms. As Bitcoin enters the new trading week, traders are closely watching whether the cryptocurrency can continue holding above the $60,000 area, which has emerged as one of the most important support zones of the current cycle.
What Changed?
The recent decline has been driven by a combination of increasing realized losses, weaker institutional demand, and deteriorating market sentiment across risk assets. According to CryptoQuant data published on June 5th (2026), realized losses have surged during the latest correction as many short-term holders exited positions at a loss. This reflects the scale of the sell-off but also highlights that the market has not yet reached the extreme capitulation levels witnessed during the 2022 downturn. Bitcoin ETF demand according to Coinglass has decreased for 9 straight days. Bitcoin ETF flows remain one of the most important indicators for the market, and recent weeks have seen periods of net outflows from several major products. Since the launch of spot Bitcoin ETFs, institutional participation has become a much larger driver of price action, making ETF activity an important metric for investors to monitor. Another notable development comes from on-chain data. Recent reports indicate that a significant portion of Bitcoin’s circulating supply is currently being held at an unrealized loss. Historically, similar conditions have appeared during the later stages of bear markets, although they do not necessarily signal an immediate market bottom. At the same time, Bitcoin’s network fundamentals remain relatively stable compared to previous cycles. The network continues to process billions of dollars in value daily, and long-term holders remain a dominant force within the ecosystem.
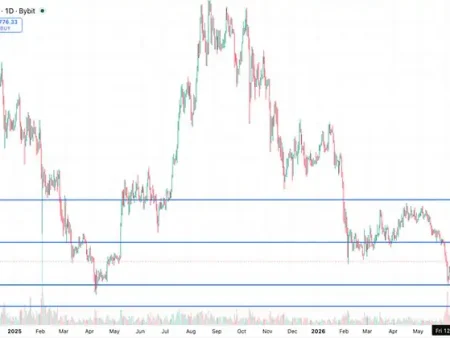
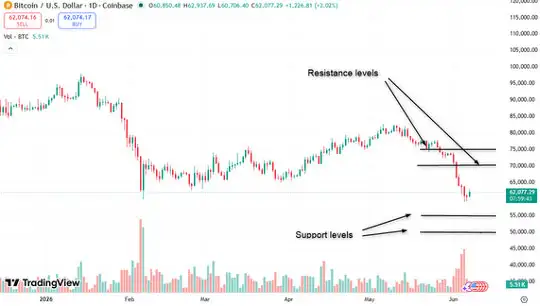
Technical Analysis for Bitcoin (BTC)
The chart covering the period since January 2026 highlights several support and resistance zones that could determine Bitcoin’s next major move. The level has acted as support on multiple occasions during the recent correction and is also viewed by many traders as an important psychological threshold. Bitcoin has tested this zone multiple times during the recent correction and has so far managed to remain above it.
A sustained move below this level would likely increase selling pressure and expose the recent swing low near $59,000. Below that area, the next major support zone sits around $55,000. If market conditions deteriorate further and Bitcoin breaks below this level, traders could begin focusing on the psychologically important $50,000 region.
On the upside, resistance remains near $65,000. A successful break above this level would improve the technical picture considerably and could shift attention toward the next major resistance zone around $70,000. Until either support or resistance is decisively broken, Bitcoin is likely to remain within a broad consolidation range. Although the recent recovery has reduced some of the immediate downside pressure, Bitcoin continues to trade well below its recent highs. From a broader perspective, the market remains in a corrective phase, and traders are looking for stronger evidence that a sustainable trend reversal has begun.
Risks to Watch
Despite the recent stabilization, several risks remain on the table for Bitcoin investors. The most immediate risk is a breakdown below the $60,000 support zone. Such a move would likely increase downside momentum and raise the probability of another test of lower support levels. Investors should also continue monitoring ETF flows. Sustained outflows from Bitcoin investment products could signal weakening institutional demand and create additional pressure on the market.
On-chain activity remains another important factor. A decline in active addresses, transaction volumes, or network usage could indicate weakening participation across the Bitcoin ecosystem. Broader financial market conditions also matter. Bitcoin has become increasingly sensitive to shifts in global risk appetite, meaning weakness in equities or other risk assets could weigh on cryptocurrency prices. Regulatory developments remain another area of focus, particularly as governments and financial regulators continue developing frameworks for digital assets and cryptocurrency investment products.
What Could Drive Bitcoin Higher?
MicroStrategy founder Michael Saylor recently described current market conditions as a buying opportunity. Given his long-standing bullish stance on Bitcoin, investors may choose to weigh his comments accordingly.
Well, not a big surprise that he’s positive perhaps. He also talks about the AI buildup that absorb capital and create temporary pressure on financial markets. Saylor also argues that the ongoing AI infrastructure buildout strengthens the long-term case for Bitcoin, although the connection between the two remains open to interpretation.
The liquidation pressure with lots of bulls liquidated is gone after Bitcoin reached 60k during the weekend.
The Crypto Fear & Greed Index currently stands at 27 out of 100, indicating elevated levels of pessimism among market participants. Historically, periods of extreme fear have often coincided with important market turning points, although there are no guarantees that history will repeat itself. Meanwhile, Cathie Wood has raised the Bitcoin target to 1.25 million per coin according to a recent Yahoo article. Banks such as Citybank also have way higher price estimates for Bitcoin, such as 143,000 USD base case and 189,000 USD bull case.
Finally, the introduction of new cryptocurrency-related products by Goldman Sachs demonstrates that large financial institutions continue expanding their presence in the sector despite recent market weakness.
Bitcoin Outlook
After falling more than 25% from its May high, Bitcoin enters new trading week attempting to stabilize above a key support area. While the recent rebound is encouraging, current on-chain data suggests that the market has not yet experienced the same degree of capitulation that characterized previous major bear-market bottoms. For now, the battle between support near $60,000 and resistance around $65,000 remains the dominant theme. A breakout beyond either of these levels would provide a clearer indication of Bitcoin’s next medium-term direction. Until then, investors are likely to focus on on-chain metrics, ETF flows, and network activity for clues about whether the current correction is nearing its end or whether additional volatility lies ahead.